Dashboard projected transactions
Display upcoming billing events
BillPro displays the projected transactions for recurring payments on the projected transactions chart and sheets.
To display the chart in the Projected Transactions panel with a breakdown by Daily, Weekly, and Monthly, select the corresponding tabs.
For these options, BillPro displays the following periods.
- Daily: next 2 weeks
- Weekly: next 12 weeks
- Monthly: next 12 months
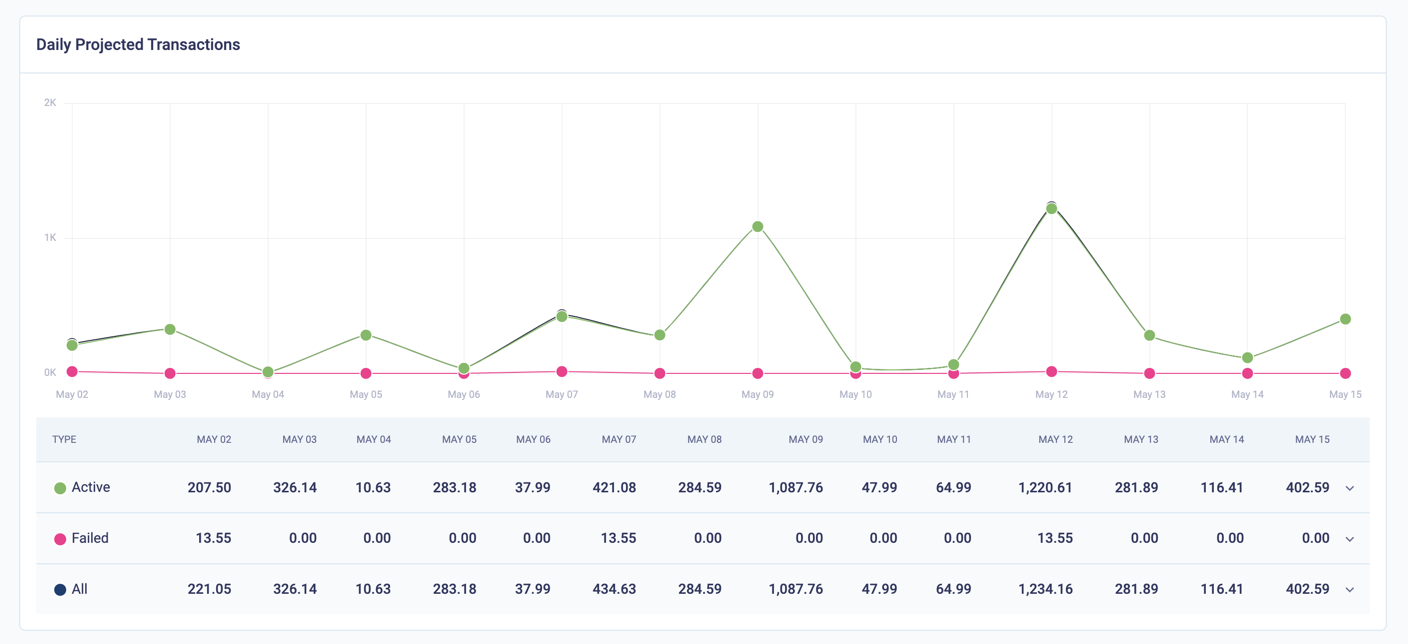
Daily projected transactions on the dashboard
To display figures on the chart, mouse over the points.
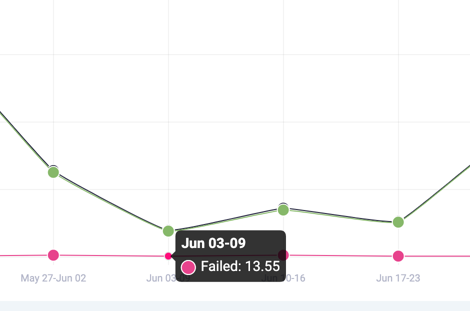
Display figures on the chart by mousing over a point
The default view displays totals for projected payments broken down by the following order types.
| Indicator | Payment type | Description |
|---|---|---|
| Green | Active orders | Includes payments with scheduled billing events for active orders |
| Red | Failed orders | Includes payments with scheduled billing events for failed orders |
| Black | All orders | The sum of projected payments for active and failed orders. |
For each of the above totals, you can open a breakdown panel with the following categories:
- 1 Month
- 28 Days
- 14 Days
- 1 Week
- Custom
The following screenshot displays the breakdown of projected transactions for Active and Failed orders.
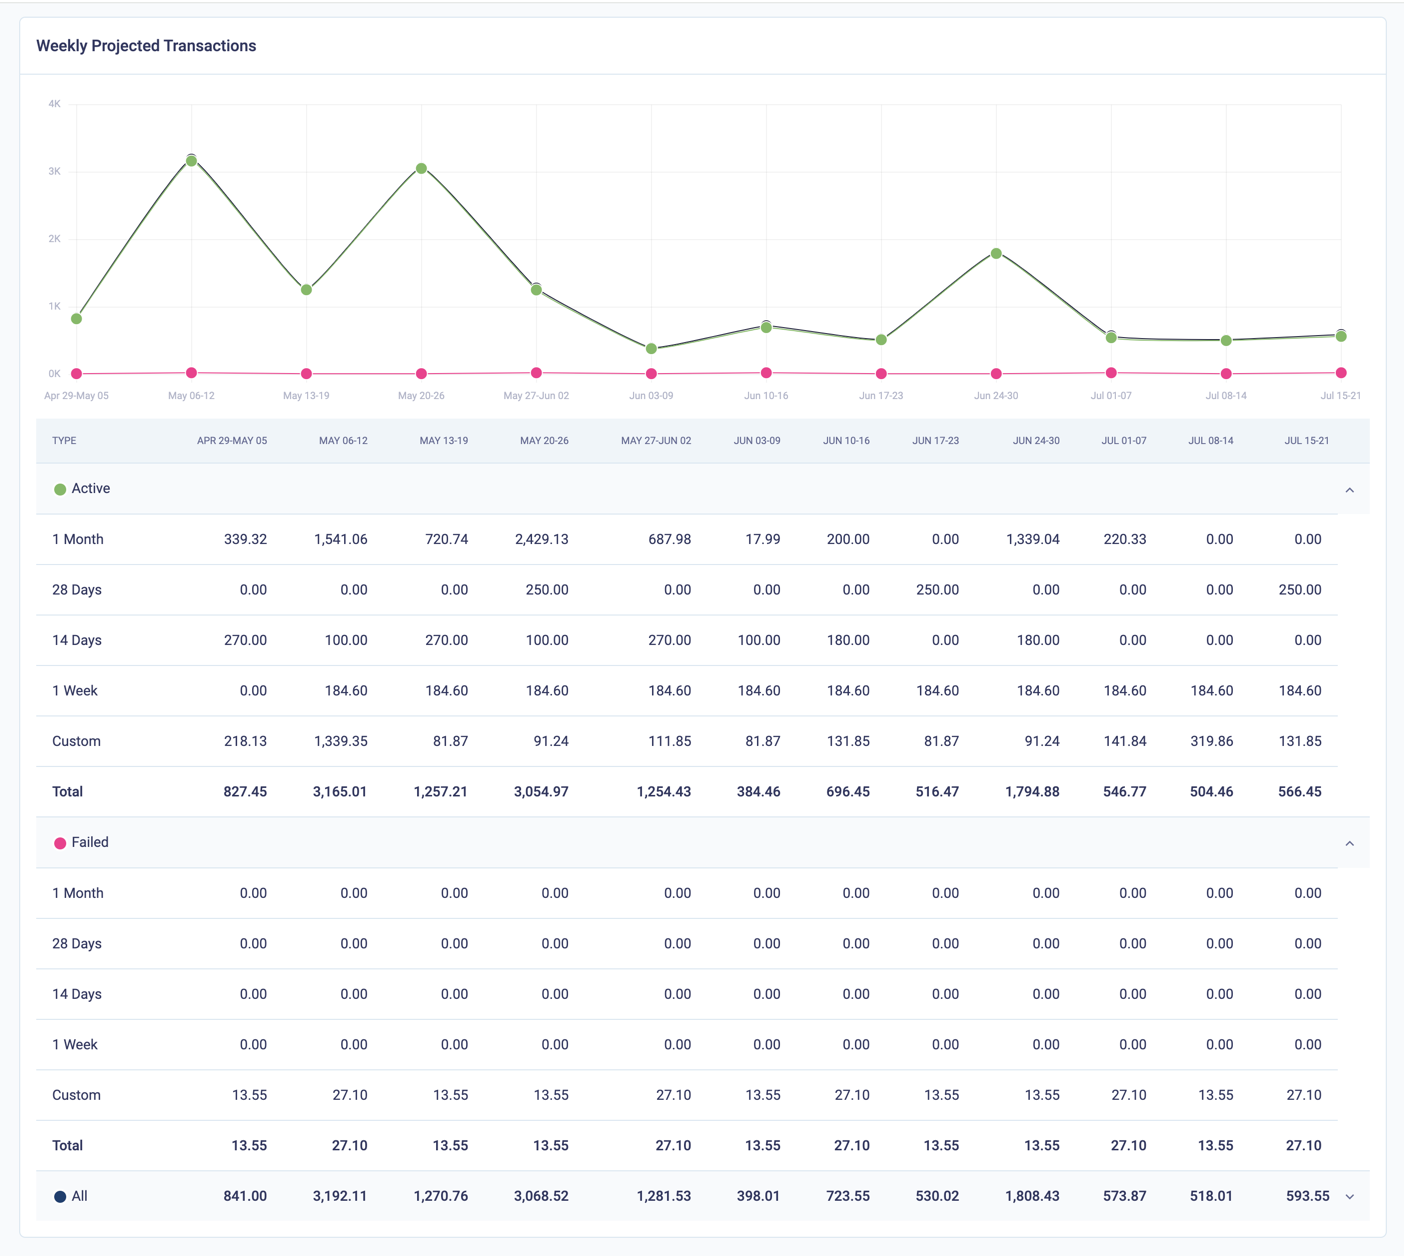
Display weekly projected transactions and totals
Transaction Reports and ViewsYou can download the full data in the Projected payments report.
Updated over 1 year ago